
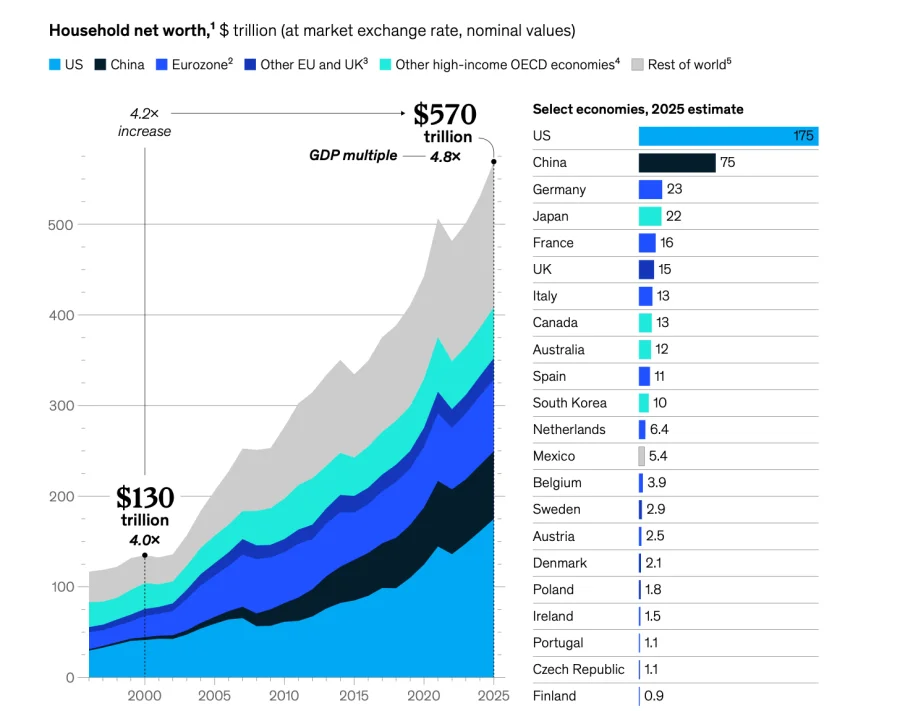
In 2025, the world’s households collectively became $40 trillion richer. That is more than the entire annual output of Japan, Germany and the United Kingdom combined — added to balance sheets in just one year. The total net worth of households globally now stands at $570 trillion, while the full universe of global assets — including real estate, equities, bonds and infrastructure — has swollen to nearly $1.8 quadrillion, according to the McKinsey Global Institute’s new report “Global Balance Sheet 2026: Imbalance and Divergence.”
The headline numbers are staggering: wealth is now more than quadruple what it was in 2000, after adjusting for inflation and exchange rates. But McKinsey’s dry language betrays a deeper unease. “This faster growth rate than GDP poses questions about its health and stability,” the report notes. The wealth boom, in other words, is increasingly decoupled from the real economy.
$570 trillion in household net worth — but not everyone is equally richer
The $40 trillion addition pushed the average annual growth rate for household wealth to 7.3%, outpacing the 5.9% average seen since 2000. Yet the gains are far from uniform. Wealth per capita rose in most countries, but the biggest jumps came in the United States, China, India and Western Europe — largely driven by soaring stock markets, rising home values and a flood of liquidity. In many developing economies, especially in Africa and parts of Latin America, the increases were modest or even negative in real terms.
Why McKinsey calls it a “paper wealth” economy
The institute’s analysis reveals a critical distinction: most of the new wealth exists on paper, not in physical factories, roads or job-creating enterprises. Asset prices — particularly equities, real estate and sovereign bonds — have climbed far faster than capital formation or productivity. McKinsey warns that such “paper wealth” can evaporate quickly if interest rates rise, liquidity tightens or investor sentiment shifts. The $1.8 quadrillion global balance sheet, while a nominal record, is also a measure of vulnerability.
Who gained most — and who missed out
The report shows that the wealthiest 10% of households captured roughly 60% of the $40 trillion increase, largely through equity holdings and property portfolios. Middle-income families in developed economies saw moderate gains from home price appreciation and pension fund returns. But for renters, young workers, and those in fragile economies, the wealth boom has been largely invisible. In countries where inflation eroded real incomes faster than asset prices grew, households effectively became poorer.
McKinsey’s official assessment and policy warnings
“The rate of wealth creation has outpaced that of output, which is historically tied to financial imbalances,” the McKinsey report states. The institute does not call a crash, but it flags several risks: overheating asset markets, rising household debt in some regions, and a widening gap between financial wealth and productive capacity. It urges policymakers to focus on “sustainable, inclusive wealth creation” rather than relying on asset inflation.
What a $1.8 quadrillion balance sheet really means
To put the number in perspective: $1.8 quadrillion is roughly 18 times global annual GDP. Even a one-percentage-point swing in asset values would erase or add $18 trillion — more than the combined economies of Germany, Japan and the UK. The sheer magnitude means that small changes in interest rates, corporate earnings or geopolitical stability can have outsized effects on household balance sheets, making the global economy more susceptible to wealth-driven cycles.
Confirmed facts vs. what remains unclear
McKinsey’s data is compiled from central bank balance sheets, national account statistics, and the institute’s own modelling. The $40 trillion addition and $570 trillion total are verified aggregate figures. What remains uncertain is the actual distribution within countries — the report uses per capita averages, not granular household-level data — and how much of the wealth can be considered “liquid” (easily accessible) versus locked in illiquid assets. Also unclear is the precise impact of currency fluctuations, as the figures are in nominal dollars at market exchange rates.
The widening gap between asset haves and have-nots
Even within wealthy nations, the wealth surge has deepened divides. In the U.S., the top 1% own about 30% of total household assets, a share that has been rising steadily. Millennials and younger Gen Z households, burdened with student debt and facing high housing costs, have captured a far smaller slice. In India, urban property owners and equity investors benefited, while rural households — whose primary asset is land — saw slower growth. The pattern repeats in varying degrees across the globe, raising questions about social cohesion and political stability.
Is the paper wealth boom sustainable?
Past episodes of rapid asset inflation followed by sudden corrections — 2008, 2000, 1990 Japan — offer cautionary lessons. McKinsey does not predict an imminent crash, but it notes that the current cycle is unusual because of the sheer scale of financial assets (especially sovereign bonds and central bank reserves) that have been created since 2020. If the global economy enters a downturn, the “wealth effect” that has supported consumption could reverse sharply, leading to a cycle of falling asset prices and reduced spending.
What this means for ordinary households and policymakers
For the average saver, the takeaway is not to assume paper gains are permanent. Diversification, debt reduction, and focusing on income rather than speculative appreciation remain sound strategies. For governments, McKinsey’s report is a call to measure wealth beyond headline numbers — tracking productive investment, income mobility, and financial resilience. For investors, the fact that global assets are 18 times GDP suggests that valuations are historically stretched, though timing such cycles is notoriously difficult.
Future outlook
Looking ahead, the trajectory of household wealth will depend on how central banks manage inflation, whether productivity growth accelerates, and how China’s property market and U.S. equity valuations evolve. McKinsey’s baseline scenario assumes moderate growth of 4–5% annually, but the institute also models a “correction” scenario where a 15% decline in asset prices could erase $85 trillion in household wealth — more than twice the gain of 2025. The report makes clear that the global balance sheet has become a giant, fragile machine.
Our Take
The McKinsey report is both a celebration and a warning. The $40 trillion wealth gain is real, but its composition — driven largely by asset inflation rather than productive capacity — should give policymakers pause. For India and other emerging economies, the lesson is clear: a reliance on real estate and stock market booms to generate wealth can leave households exposed when the cycle turns. Sustainable wealth creation requires stronger job markets, higher productivity, and broader financial inclusion. As the world’s balance sheet becomes more interconnected and leveraged, the gap between paper wealth and real economic health is a risk no country can afford to ignore.
Frequently Asked Questions
What is the global household wealth as of 2025?
According to McKinsey Global Institute, global household net worth reached $570 trillion at the end of 2025, after adding a record $40 trillion during the year.
What does “paper wealth” mean in the McKinsey report?
Paper wealth refers to asset value increases — stocks, real estate, bonds — without a corresponding increase in productive capital or real economic output. McKinsey warns that such wealth can disappear quickly if markets fall.
How does the 2025 wealth increase compare to previous trends?
The 7.3% growth rate outpaced the 5.9% average since 2000. It is the largest dollar addition ever recorded, and the global assets-to-GDP ratio has risen to 18 times global output.
Which countries benefited the most from the wealth surge?
The United States, China, India, and Western Europe saw the strongest gains, driven by equity markets and real estate. Lower-income countries in Africa and Latin America saw much smaller increases in per capita wealth.
Could the $40 trillion gain reverse?
Yes. McKinsey models a correction scenario where a 15% drop in global asset prices could wipe out $85 trillion in household wealth, more than double the 2025 gain. Past asset bubbles have shown such reversals are possible.